

Here at Ascend Inbound, we exist to bring our clients results. We're not just here to design pretty websites (although we do that, too), or talk about "getting on the first page of Google" (whatever that means...). We actually deliver in terms of qualified traffic, leads and revenue.
So how do we track those results?
One way we do that is with Databox.
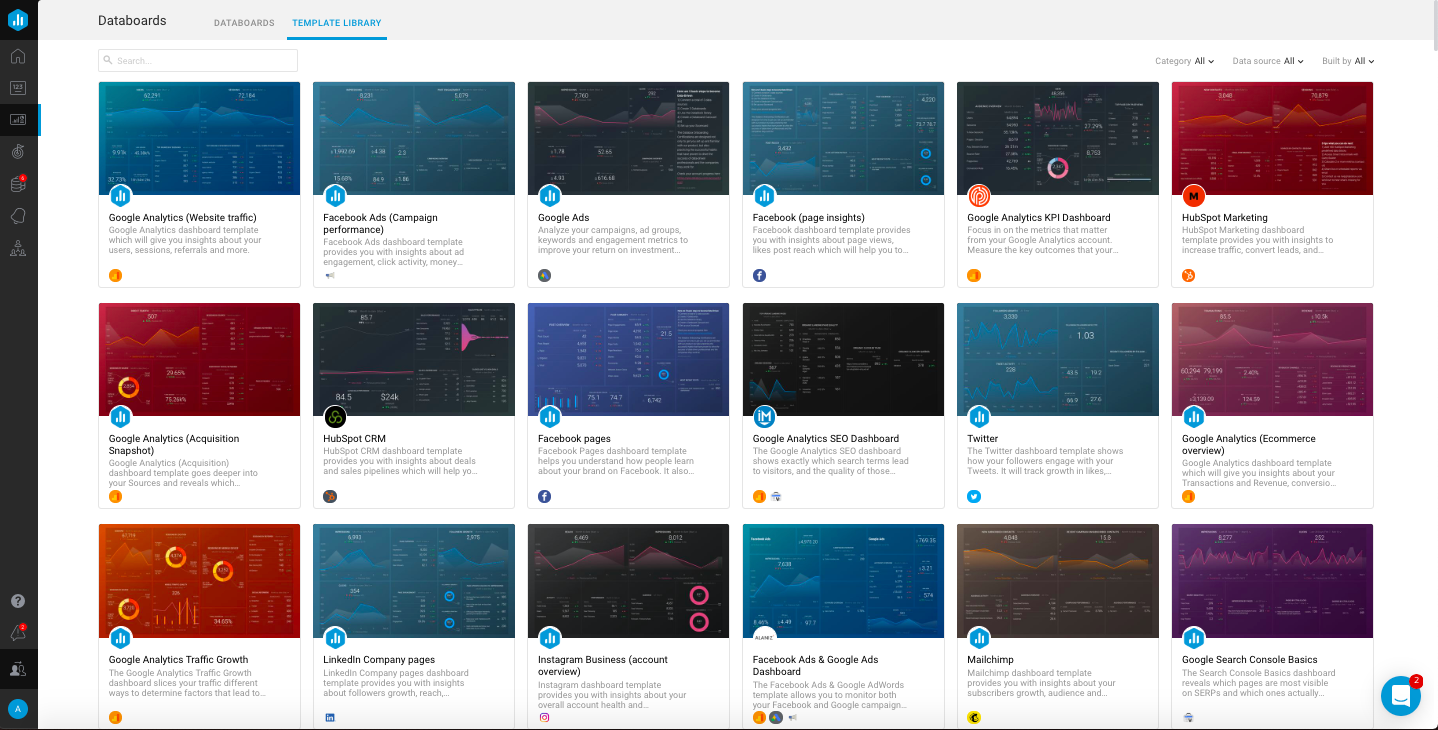
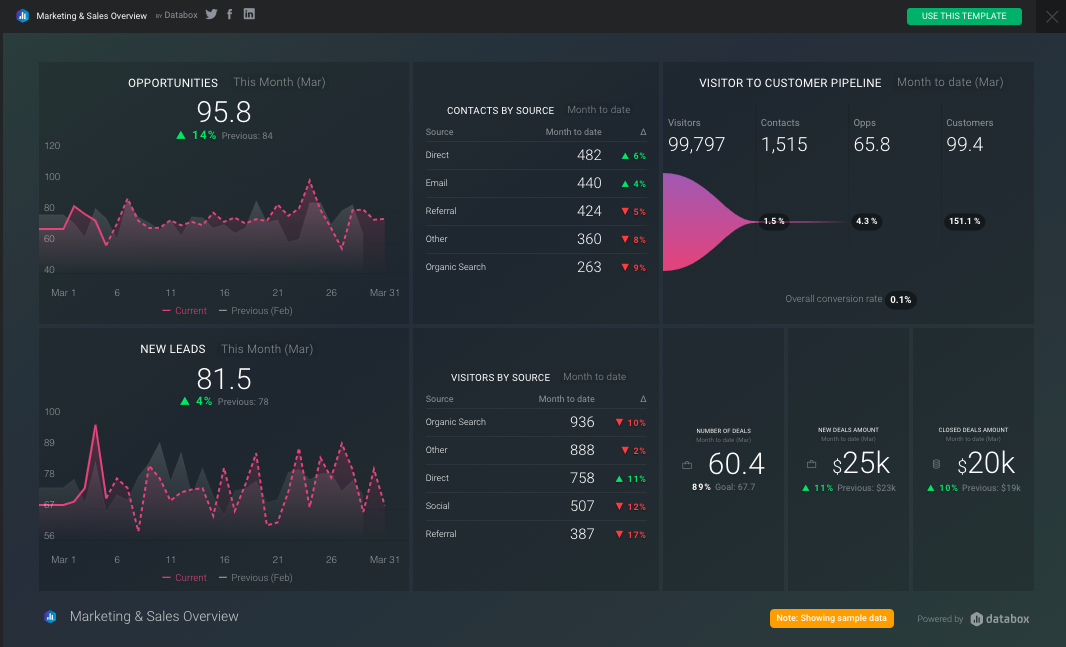
Databox is a reporting software that plugs into the marketing tools our clients use. We can easily say that it checks all the boxes. Not only is Databox able to seamlessly integrate multiple tools and pull data from each one, but the reports generated by the software are beautiful, can be easily customized, and they’re available across devices, including mobile.
Some perks of using Databox include the following:
Seamless Integration
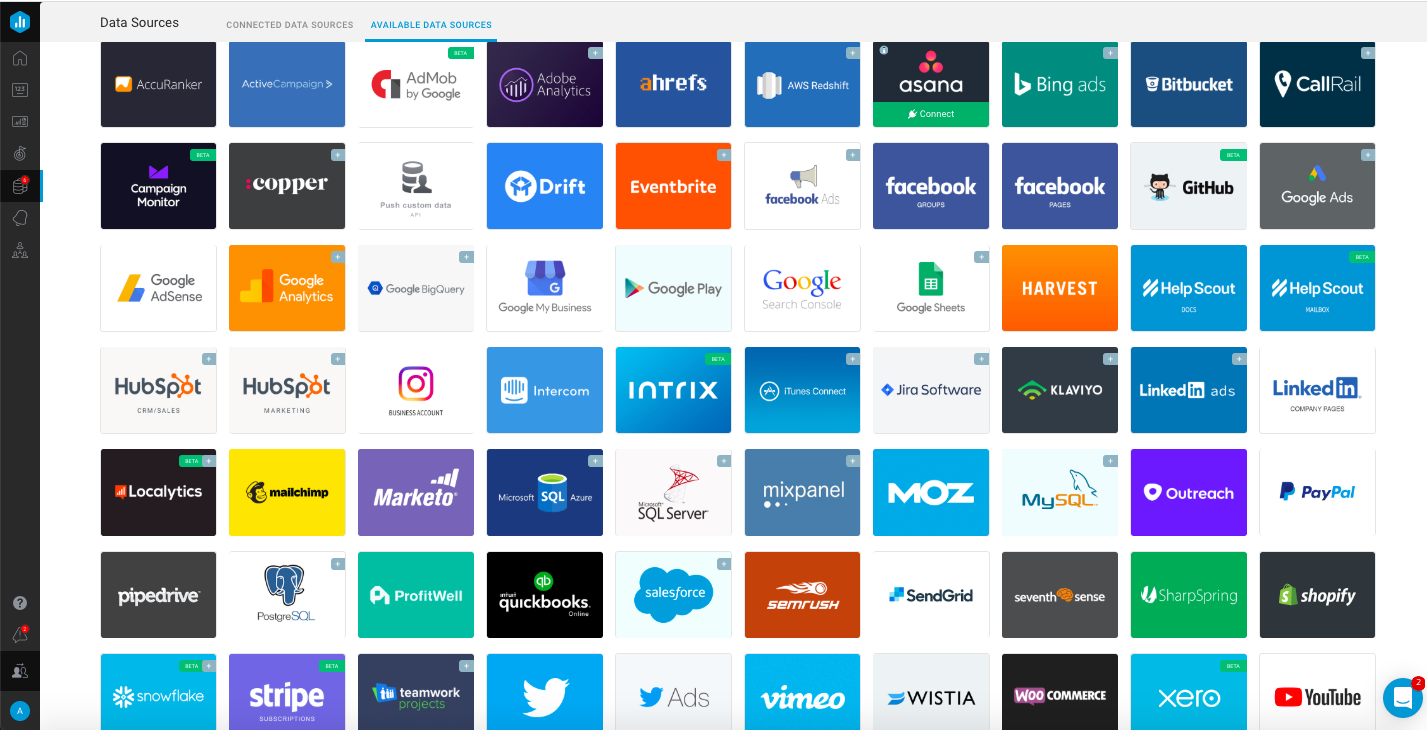
Databox can pull metrics from numerous data points, including Google Analytics, Facebook Ads, LinkedIn Ads, Google Tag Manager, and HubSpot.
Flexibility
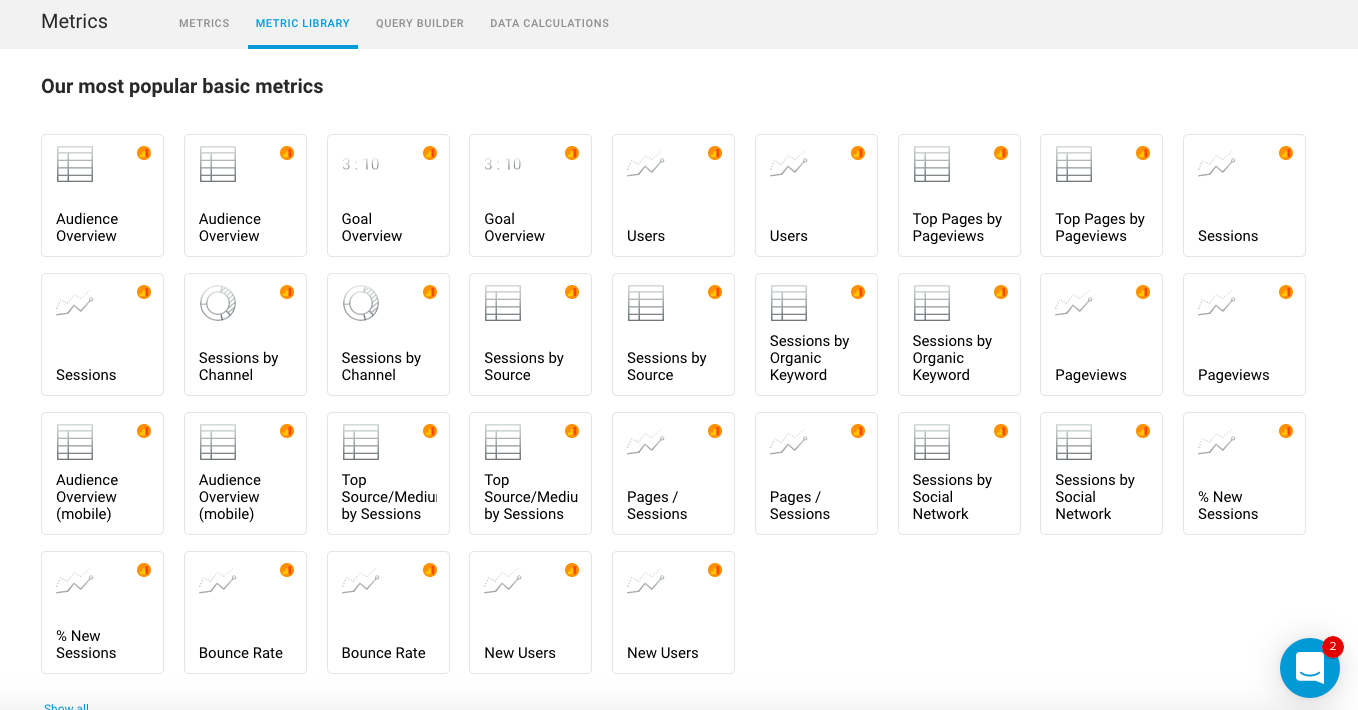 Everything in Databox is completely customizable. If there is a report that you need and you can think of it in your head, chances are you can create it in Databox. The reports are aesthetically pleasing and are easy to read and follow.
One Location for All Reports
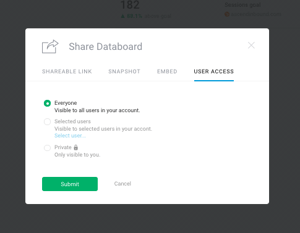
Client Access
Big Picture
Overall Accountability
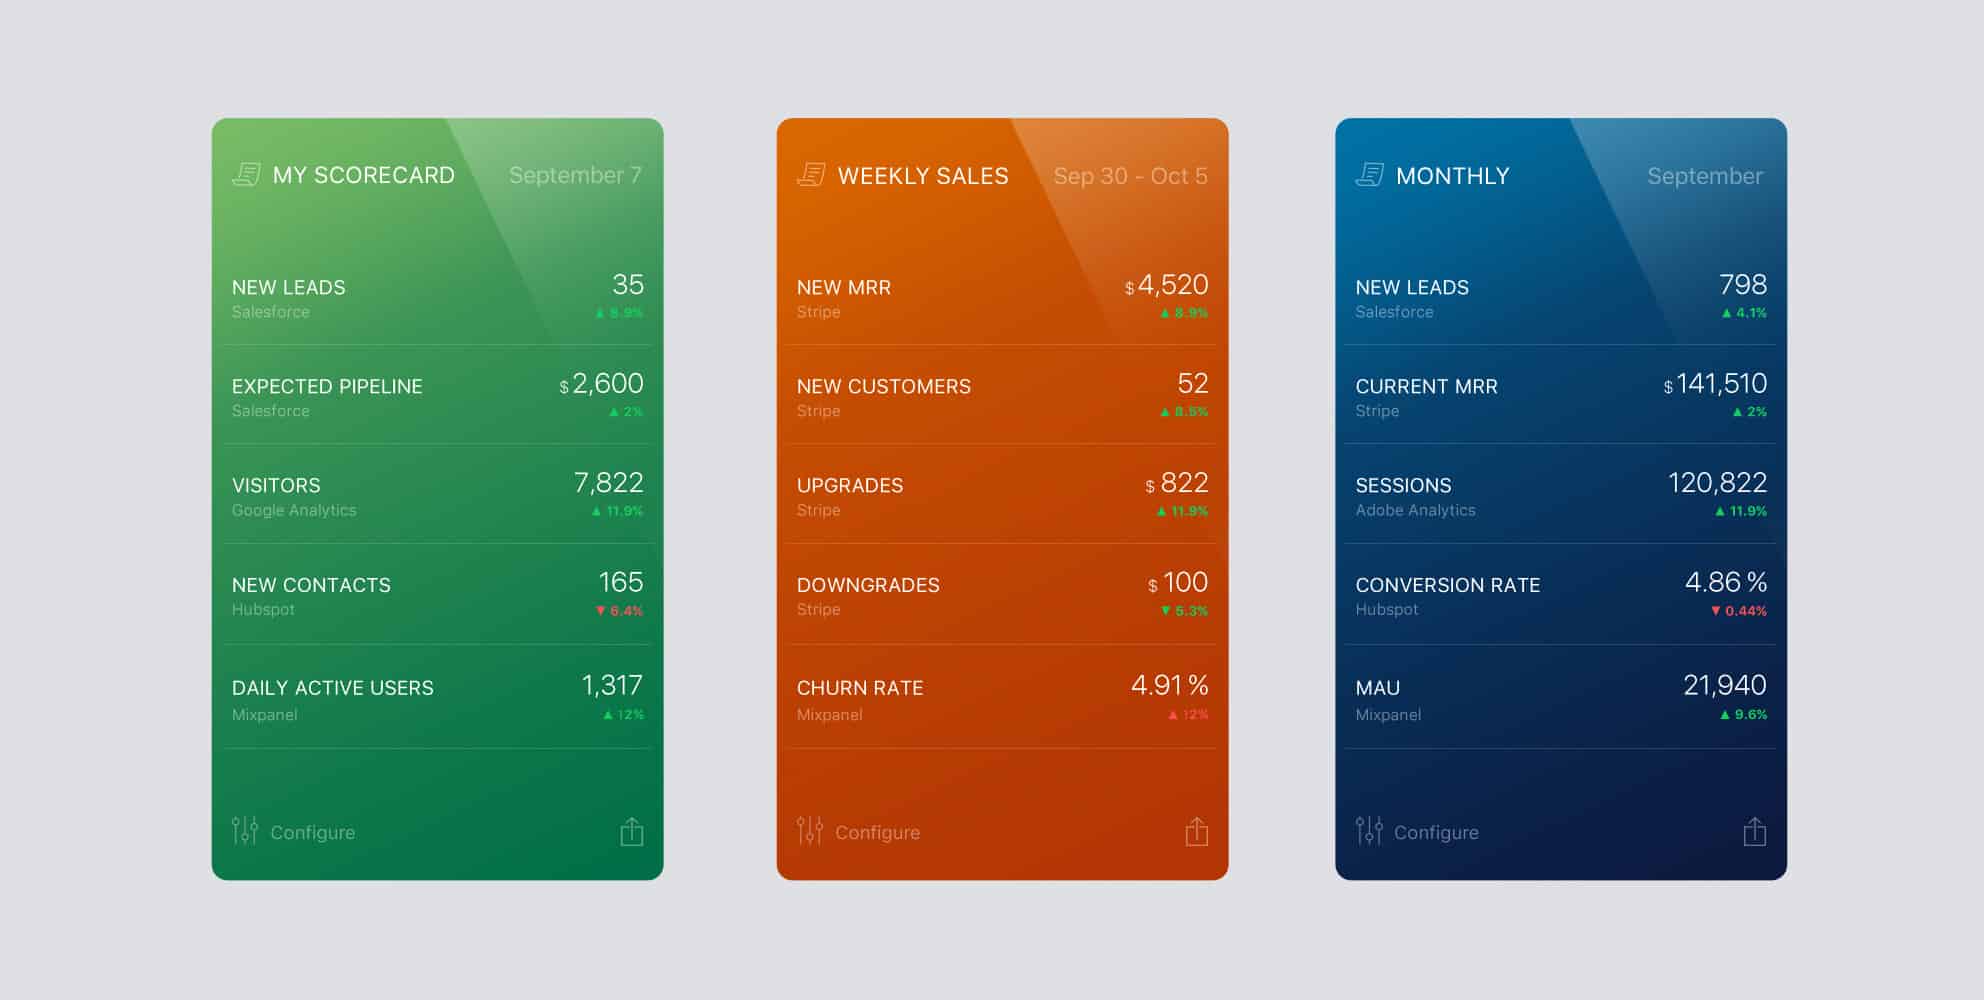
Databox has scorecards that users can use to track where they stand against their key targets. It allows users to see if traffic is standing up to where it needs to be this month or if conversion rates are falling behind. In general, it gives clients an idea of what they might need to work on, especially on a weekly basis, to meet the goals for the month.
Read the Transcript
Steven: Hey guys, welcome back to another episode of The Basecamp at Ascend Inbound Marketing. We have Anne with us today, our agency director, and we're going to talk a little bit about maybe some tools we use in-house to measure KPI and different data points for our clients. I know one of the big ones-
Anne: Sure.
Steven: ... That we use is Databox, Databox.
Anne: It's like pecan and pecan [crosstalk 00:00:42].
Steven: Right, we'll ask Brian Mosley later. Data or data, Brian?
Anne: Yeah.
Steven: Respond in the comments below. Yeah, phonetics. Here we go. How do we use it? Why do we use it and yeah, we'll start there.
Anne: Okay. Yeah, so Databox is essentially reporting software, but it's a very awesome reporting software because it integrates with a lot of different tools and the reports within Databox are beautiful and customizable and available across devices. They really have checked all the boxes, right? They have a great API, they work with a lot of existing integrations and tools and they're mobile friendly. We love Databox because we can create custom reports for our clients. And give them access to those reports in real time and then also be able to come back to those reports on a monthly or quarterly basis whenever we meet with them periodically to review the stats and numbers and in a single place basically. The clients love it. Our partners love it because they do have that real time access, but also the visuals of it are very helpful to be able to see their performance on Google analytics over time or how their Facebook ads campaigns are performing. Everything that they could possibly want reporting on, if it's digital marketing related, you can essentially pull it in to Databox.
Steven: Well also from a sales perspective, because I know again you mentioned it and kind of touched on all of the integrations that are just seamless with Databox that is incredible.
Anne: Right.
Steven: I mean everything from QuickBooks to SQL servers.
Anne: Sure. Mm-hmm (affirmative).
Steven: I mean, there's so many data points that you can pull metrics from. So from a sales standpoint, I think that it's also tremendous as well.
Anne: Yeah, absolutely. Absolutely. Databox does integrate with many different CRMs of course, HubSpot is one of them. As you're tracking your pipelines in HubSpot, you can provide reports on that and Databox as well to show the sales leader boards where they stand against their quotas, things like that. And a lot of people ask, "Well okay, I'm paying for HubSpot. HubSpot has reporting, why would we use Databox too? Why are we getting out of HubSpot?" And that's a really good question because there is a lot of reporting available in HubSpot and there are a lot of really great reports in HubSpot and they are getting better at that, every day really.
But it doesn't have everything in there. And everything in Databox is completely customizable, basically if there is a report that you need and you can think of it in your head, you can get it out of Databox and so that's one reason why we use it. Another reason why we use it is because our partners are not necessarily only using HubSpot. In fact, that's almost never the case that that is the only tool that they're using.
Steven: Right.
Anne: They're using Google Analytics for more granular reporting on their website. They're using Facebook Ads and LinkedIn Ads and Google Tag Manager and a breadth of tools to manage their digital marketing efforts. And this is a platform that we can use to report on all of those in one place and even combine reports to show an overall performance.
Steven: Mm-hmm (affirmative). I know we've set up different dashboards for different people within a specific organization, right?
Anne: Mm-hmm (affirmative).
Steven: The marketing manager might get... Have a dashboard that they... They all have access to maybe one collective birdseye view.
Anne: Right.
Steven: But the marketing manager, like you said, might have one that had seventh sense data and on email sends and opens-
Anne: Right.
Steven: ... And stuff like that. And everything from YouTube and Google Analytics, whereas sales might have something different.
Anne: Right.
Steven: And then a lot of times any... I guess sell to an organization, the buck stops with the CEO. And a lot of times they're not in the day to day nitty gritty-
Anne: Sure.
Steven: ... With marketing and sales. They just want to see the results. So then having a combined dashboard that just shows those KPIs for them.
Anne: Yeah, that's 100% right. Especially when you're talking about a CEO or a business owner, they just want the big picture and they don't want to have to dig for it either. They don't want to have to-
Steven: Sure.
Anne: ... Figure out where they're supposed to log into and then which report they're looking for, building a report every time that they want to see it. They just want it there. And whether that is a URL that they can have bookmarked in their browser or they get a snapshot that's automatically emailed to them every week.
Steven: Mm-hmm (affirmative).
Anne: And that's a big thing the Databox has available too, is that you can get automatic emails with your report sent to you every week, every month, however often you want to see them. And then in addition to that, there are also scorecards that you can use to track where you stand against your key targets. Is your traffic standing up to where it needs to be this month? Is your conversion rate really falling behind? This'll give you an idea of where you might need to focus on, especially on a weekly basis, so more frequently.
Steven: Mm-hmm (affirmative).
Anne: Are you falling off against those metrics or those KPIs and do we need to really hone in and focus on these before the end of the month so that we can meet our goals for the month?
Steven: I think it does a good job keeping... We use it, right?
Anne: Mm-hmm (affirmative). Yeah.
Steven: Internally just with our send team and I think it helps keep us motivated as a unit as well. We have them up on a board in our conference room-
Anne: Yeah.
Steven: ... On a big TV, so being able to just at any point in time to look up there and see where we are on those different targeted goals that we have-
Anne: Right.
Steven: ... It really kind of helps us stay focused on what our-
Anne: Right.
Steven: ... Primary goals are and not getting off too far in the weeds, which sometimes happens in any organization.
Anne: Right. Yeah, that's a really good point too Steven. I mean this is more of an organizational thing, but just of course you've got to have your goals and you've got to have your targets-
Steven: Right.
Anne: ... Because without those than you can't set up a strategy to get there. And one of the things that we do here at Ascend is follow the EOS model from traction.
Steven: Mm-hmm (affirmative).
Anne: And so-
Steven: And just real quick.
Anne: Mm-hmm (affirmative).
Steven: EOS stands for?
Anne: Entrepreneurial Operating System, thank you. But with the EOS of course we set our five year, 10 year, one year targets, but we also have quarterly Rocks. These are the things that we need to accomplish this quarter to make sure that we're on track for the whole year and the longterm. And that is where Databox has really come in clutch for us because we can track all of our Rocks in Databox. And some of those are even dynamic, they pull right out of HubSpot. We don't even have to think about them, but some of them are manual and that's fine too because I just have a Google Spreadsheet that I look at every week and make sure it's up to date and then it pops in the rest of the reports automatically and when we have our weekly meetings, then we review those and see where we stand. And it's been really helpful for us to stay on track of where we need to get and even more so than that, just making sure that we don't veer off course as well.
Steven: Right.
Anne: Focusing on things that maybe we should put aside for a little while.
Steven: And I think that's applicable in really any business, right? With us being a marketing agency that is selling marketing and strategy and video and web design and stuff. But for any other company or organization that's B2B or B2C, just having those specific goals set up and just man, everybody being able to see where you are, what it's going to take to achieve it, how far you are along in that process.
Anne: Right.
Steven: And that's this huge, that's tremendous.
Anne: Right, right. Yeah, I mean, and that it all goes back to the strategy and the goals because we can set up reports all day long, but they don't mean anything if they're not getting your business where it needs to be. Databox definitely buys in to that mentality as well. And they have a lot of great resources, a lot of even their own courses that you can take to learn about reporting and setting up your reports in a way that will help grow your business and become more profitable. I highly recommend that even if you don't sign up for a Databox account that you check out their resources because they got some good stuff.
Steven: Well, I think that... Another thing that I'm just thinking about here on the sales side of it is accountability.
Anne: Mm-hmm (affirmative). Yeah.
Steven: Because everybody tends to do a little more and excel a little bit farther whenever-
Anne: Yeah.
Steven: ... There's some competition involved. If their expectations on any type of... Within any process from a sales perspective, you throw those up on a board that everybody has access to through URL or snapshot that's mailed out every week. You start lagging behind, it doesn't take long to really kind of-
Anne: Yeah.
Steven: ... Realize, man, I've got to step it up.
Anne: Yeah, that's so true. And I think it's important for everybody to have accountability for certain things that can be measured. And that's how our Rocks dashboard is.
Steven: Mm-hmm (affirmative).
Anne: There are components of it that everybody has a stake in, at least one of the Rocks on our dashboard and everybody on our team is responsible for at least one of them to make sure that we meet those goals by the end of the quarter. And so yeah, to push those up at the beginning of the week, each one of us can look at that and determine, okay, well how do I need to move forward to get us where we need to be.
Steven: Well, cool. Yeah. Well thanks so much for just a little, I guess knowledge on Databox-
Anne: Yeah.
Steven: ... And what it is and how we use it. Yeah, thanks for your time-
Anne: Cool.
Steven: ... And appreciate you watching the video and yeah, you have any questions, feel free to reach out. We got lots of contacts available through our website, chat forums, et cetera. See you guys next week.